A healthy, delicious and sustainable source of protein, quality seafood is a dietary staple for people all over the world. Whether it’s for the environment or their own personal health. the more people learn about seafood, the more they substitute more of their beef and pork meals for fish and other seafood. But just how much seafood can someone consume as part of a healthy diet? The biggest health concern that comes with eating a lot of seafood is the mercury content. Unfortunately, knowing how to safely manage mercury levels in your diet isn’t easy. We’ve looked at the research and talked to the experts and here is our take on the definitive guide for estimating mercury levels in seafood—and what this means for making healthy food choices.
Recommended Mercury Levels in Your Diet
Mercury is a heavy metal that has harmful effects that can be observed throughout the body. Mercury has toxic effects on some of the most vital organs and body systems including the nervous, digestive, and immune systems as well as the lungs, kidneys, skin, and eyes. The harmful effects are particularly pronounced on small children and the developing fetus.
There is no such thing as a “perfectly safe” level of mercury in your diet, but there is also no way to eliminate mercury from your diet completely. Trace amounts of mercury occur naturally in many of the foods we eat. Plus, mercury’s potential harm is very dose dependent. With this in mind, the Environmental Protection Agency conducted research to establish a “safe” or “reference” dose for mercury.
In 2001, the recommendations set forth by the EPA were to limit mercury intake to 0.1 micrograms per kilogram of body weight per day—or about .045 micrograms of mercury per pound per day. So, someone who weighs 200 pounds (90 kilograms) could safely consume about 63 micrograms of mercury each week. Someone who weighs 150 pounds (68 kilograms) could safely consume 47 micrograms.
When they set out to establish this safe reference dose, they did so with the most vulnerable population in mind: Pregnant women. Thus, people—and pregnant women in particular—could recognize a reasonable level of mercury consumption that was unlikely to create adverse health effects. This reference for a safe dose is also relative to your personal health characteristics. If you already have health problems in these areas, even a moderate amount of mercury may create complications or exacerbate symptoms.
Moreover, in the last decade, the research about the harmful potential of mercury in the human body has only grown more robust. As such, it’s common now for health professionals to cite this reference dose for the general population, while recommending that pregnant women limit their mercury consumption even further. Some researchers now suggest the actual safe reference dose should be 50-75 percent lower than the EPA’s original guidelines.
Finally, seafood isn’t the only potential source of mercury in your diet. You can find more details here about other sources of mercury, but know that if you eat a lot of processed foods with high-fructose corn syrup, you may already be getting some amount of mercury in your diet.
Choosing Seafood Based on Mercury Levels
Most fish will absorb some amount of mercury from their aquatic habitat as well as their own diet. Carnivorous fish will absorb mercury from the other fish they eat. Fish with longer life cycles will tend to accumulate more mercury in their system before being harvested. But the quality of the water and local habitat of the seafood also matters. For all these reasons, most types of seafood have consistently lower or higher mercury levels, even though there can be considerable differences between individual fish and seafood.
Due to the uncertainty of mercury levels from one fish to the next, many health experts and organizations will simply categorize seafood into general categories.
- The EPA uses Avoid, Good, and Best.
- The Safina Center uses Low, Medium, High, and Highest.
- Verywell uses Lowest, Modest, High, and Highest.
- The Spruce Eats uses Low, Medium, and High.
None of these systems are right or wrong. If you want to create a personalized estimate for your own diet and seafood consumption, take a look at our guide for calculating your weekly mercury consumption and seafood allowance.
How to Calculate the Mercury Levels in Your Seafood
You don’t need to be really good at math to calculate your weekly seafood allowance, but in addition to a chart of mercury levels for different types of seafood, you need to know two simple measurement conversions. This information will show you how to go from parts per million (ppm) of mercury content to how many micrograms of mercury you’re consuming each week in your seafood.
- There are one million micrograms in a gram.
- There are 28 grams in one ounce.
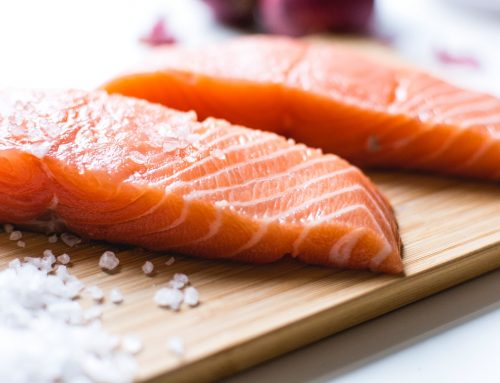
So, if you’re eating salmon with .015 ppm of mercury, then it has .015 micrograms of mercury per gram of seafood. An average serving of salmon is about 6 ounces, or 168 grams. Therefore, .015 x 168 = 2.5 micrograms of mercury.
Written as a general equation to which you can simply plug in your own numbers, it looks like this:
(Parts per million mercury for seafood type) x (ounces of seafood eaten) x (28) = (micrograms of mercury consumed)
Thus, a healthy adult who weighs 200 pounds could eat a 6 oz portion of salmon 25 times in a week before exceeding the original EPA guidelines that allow for 63 micrograms of mercury per week. Even under the stricter guidelines set forth by health researchers, you could still eat a modest portion of wild Alaskan salmon every single day—assuming it was the only source of mercury in your diet. Lobster, crawfish, shrimp, and oysters also have low mercury content that allows for a seafood-based meal nearly every day.
This doesn’t mean you can eat any type of seafood you want. Orange roughy has about four times as much mercury as salmon. Eating a 6 oz portion of orange roughy twice a week already puts the average person over their limit. Even many types of tuna, bass, and sablefish have mercury levels that are three times as high as healthier seafood choices. Swordfish has a mercury content that’s ten times higher!
Mercury Levels in Different Types of Seafood
The last thing you need to calculate your weekly seafood allowance is the average ppm for the types of seafood you eat each week. According to an FDA program that monitored mercury levels in fish and seafood between 1990 and 2012, here is a handy chart that you can easily reference for the mercury levels in your personal seafood choices.
| Fish species | Mercury concentration, average (µg/g or ppm) | Mercury concentration, 95% confidence interval (µg/g or ppm) | Number of samples | Fish category |
| Scallop | <0.01 | 0.00, 0.01 | 39 | Best choice |
| Clam | 0.01 | 0.00, 0.01 | 15 | Best choice |
| Oyster | 0.01 | 0.00, 0.02 | 61 | Best choice |
| Salmon, canned | 0.01 | 0.005, 0.02 | 19 | Best choice |
| Sardine | 0.01 | 0.01, 0.02 | 90 | Best choice |
| Shrimp | 0.01 | 0.01, 0.01 | 40 | Best choice |
| Tilapia | 0.01 | 0.01, 0.02 | 32 | Best choice |
| Anchovy | 0.02 | 0.01, 0.02 | 15 | Best choice |
| Catfish | 0.02 | 0.01, 0.04 | 59 | Best choice |
| Salmon, fresh/frozen | 0.02 | 0.02, 0.03 | 94 | Best choice |
| Squid | 0.02 | 0.02, 0.03 | 36 | Best choice |
| Crawfish | 0.03 | 0.03, 0.04 | 46 | Best choice |
| Pollock | 0.03 | 0.02, 0.05 | 95 | Best choice |
| Shad | 0.04 | 0.02, 0.06 | 15 | Best choice |
| Atlantic mackerel | 0.05 | NC | 80 | Best choice |
| Mullet | 0.05 | 0.02, 0.09 | 20 | Best choice |
| Whiting | 0.05 | 0.03, 0.07 | 13 | Best choice |
| Butterfish | 0.06 | NC | 89 | Best choice |
| Crab | 0.06 | 0.05, 0.09 | 93 | Best choice |
| Flatfish (flounder, plaice, sole) | 0.06 | 0.04, 0.07 | 71 | Best choice |
| Haddock | 0.06 | 0.05, 0.06 | 50 | Best choice |
| Atlantic croaker | 0.07 | 0.06, 0.08 | 90 | Best choice |
| Striped bass (ocean) | 0.07 | 0.04, 0.11 | 41 | Good choice |
| Trout, freshwater | 0.07 | 0.03, 0.12 | 35 | Best choice |
| Hake | 0.08 | 0.06, 0.10 | 49 | Best choice |
| Herring | 0.08 | 0.04, 0.13 | 27 | Best choice |
| Smelt | 0.08 | 0.05, 0.13 | 23 | Best choice |
| Pacific chub mackerel | 0.09 | NC | 30 | Best choice |
| Pickerel | 0.09 | 0.05, 0.14 | 16 | Best choice |
| Sheepshead | 0.09 | 0.06, 0.12 | 8 | Good choice |
| Whitefish | 0.09 | 0.06, 0.12 | 37 | Best choice |
| Lobster | 0.10 | 0.06, 0.14 | 22 | Best choice |
| Carp | 0.11 | 0.06, 0.16 | 14 | Good choice |
| Cod | 0.11 | 0.09, 0.14 | 115 | Best choice |
| Perch, ocean | 0.12 | 0.08, 0.17 | 31 | Best choice |
| Black sea bass | 0.13 | 0.10, 0.16 | 29 | Best choice |
| Tuna, light, canned (includes skipjack) | 0.13 | 0.12, 0.14 | 548 | Best choice |
| Buffalofish | 0.14 | 0.10, 0.19 | 17 | Good choice |
| Skate | 0.14 | NC | 56 | Best choice |
| Tilefish (from Atlantic Ocean) | 0.14 | 0.11, 0.19 | 32 | Good choice |
| Perch, freshwater | 0.15 | 0.10, 0.20 | 19 | Best choice |
| Monkfish | 0.16 | 0.11, 0.21 | 11 | Good choice |
| Snapper | 0.17 | 0.12, 0.23 | 67 | Good choice |
| Mahi mahi / dolphinfish | 0.18 | 0.14, 0.22 | 29 | Good choice |
| Rockfish | 0.23 | 0.17, 0.30 | 19 | Good choice |
| Weakfish/sea trout | 0.23 | 0.18, 0.30 | 46 | Good choice |
| Halibut | 0.24 | 0.20, 0.29 | 101 | Good choice |
| White croaker/Pacific croaker | 0.29 | 0.25, 0.32 | 15 | Good choice |
| Chilean sea bass/Patagonian toothfish | 0.35 | 0.29, 0.43 | 74 | Good choice |
| Spanish mackerel | 0.35 | NC | 109 | Good choice |
| Tuna, albacore / white tuna, canned | 0.35 | 0.34, 0.36 | 451 | Good choice |
| Tuna, yellowfin | 0.35 | 0.33, 0.39 | 231 | Good choice |
| Sablefish | 0.36 | 0.28, 0.45 | 26 | Good choice |
| Tuna, albacore / white tuna, fresh/frozen | 0.36 | 0.32, 0.40 | 43 | Good choice |
| Bluefish | 0.37 | 0.33, 0.42 | 94 | Good choice |
| Grouper | 0.45 | 0.38, 0.52 | 53 | Good choice |
| Marlin | 0.49 | 0.38, 0.60 | 16 | Avoid |
| Orange roughy | 0.57 | 0.53, 0.61 | 81 | Avoid |
| Tuna, bigeye | 0.69 | 0.56, 0.84 | 21 | Avoid |
| King mackerel | 0.73 | NC | 213 | Avoid |
| Shark | 0.98 | 0.91, 1.05 | 356 | Avoid |
| Swordfish | 1.00 | 0.95, 1.04 | 636 | Avoid |
| Tilefish (from Gulf of Mexico) | 1.45 | NC | 60 | Avoid |
Take note of our Affiliate Relationships that may exist with this page and companies listed on it.


